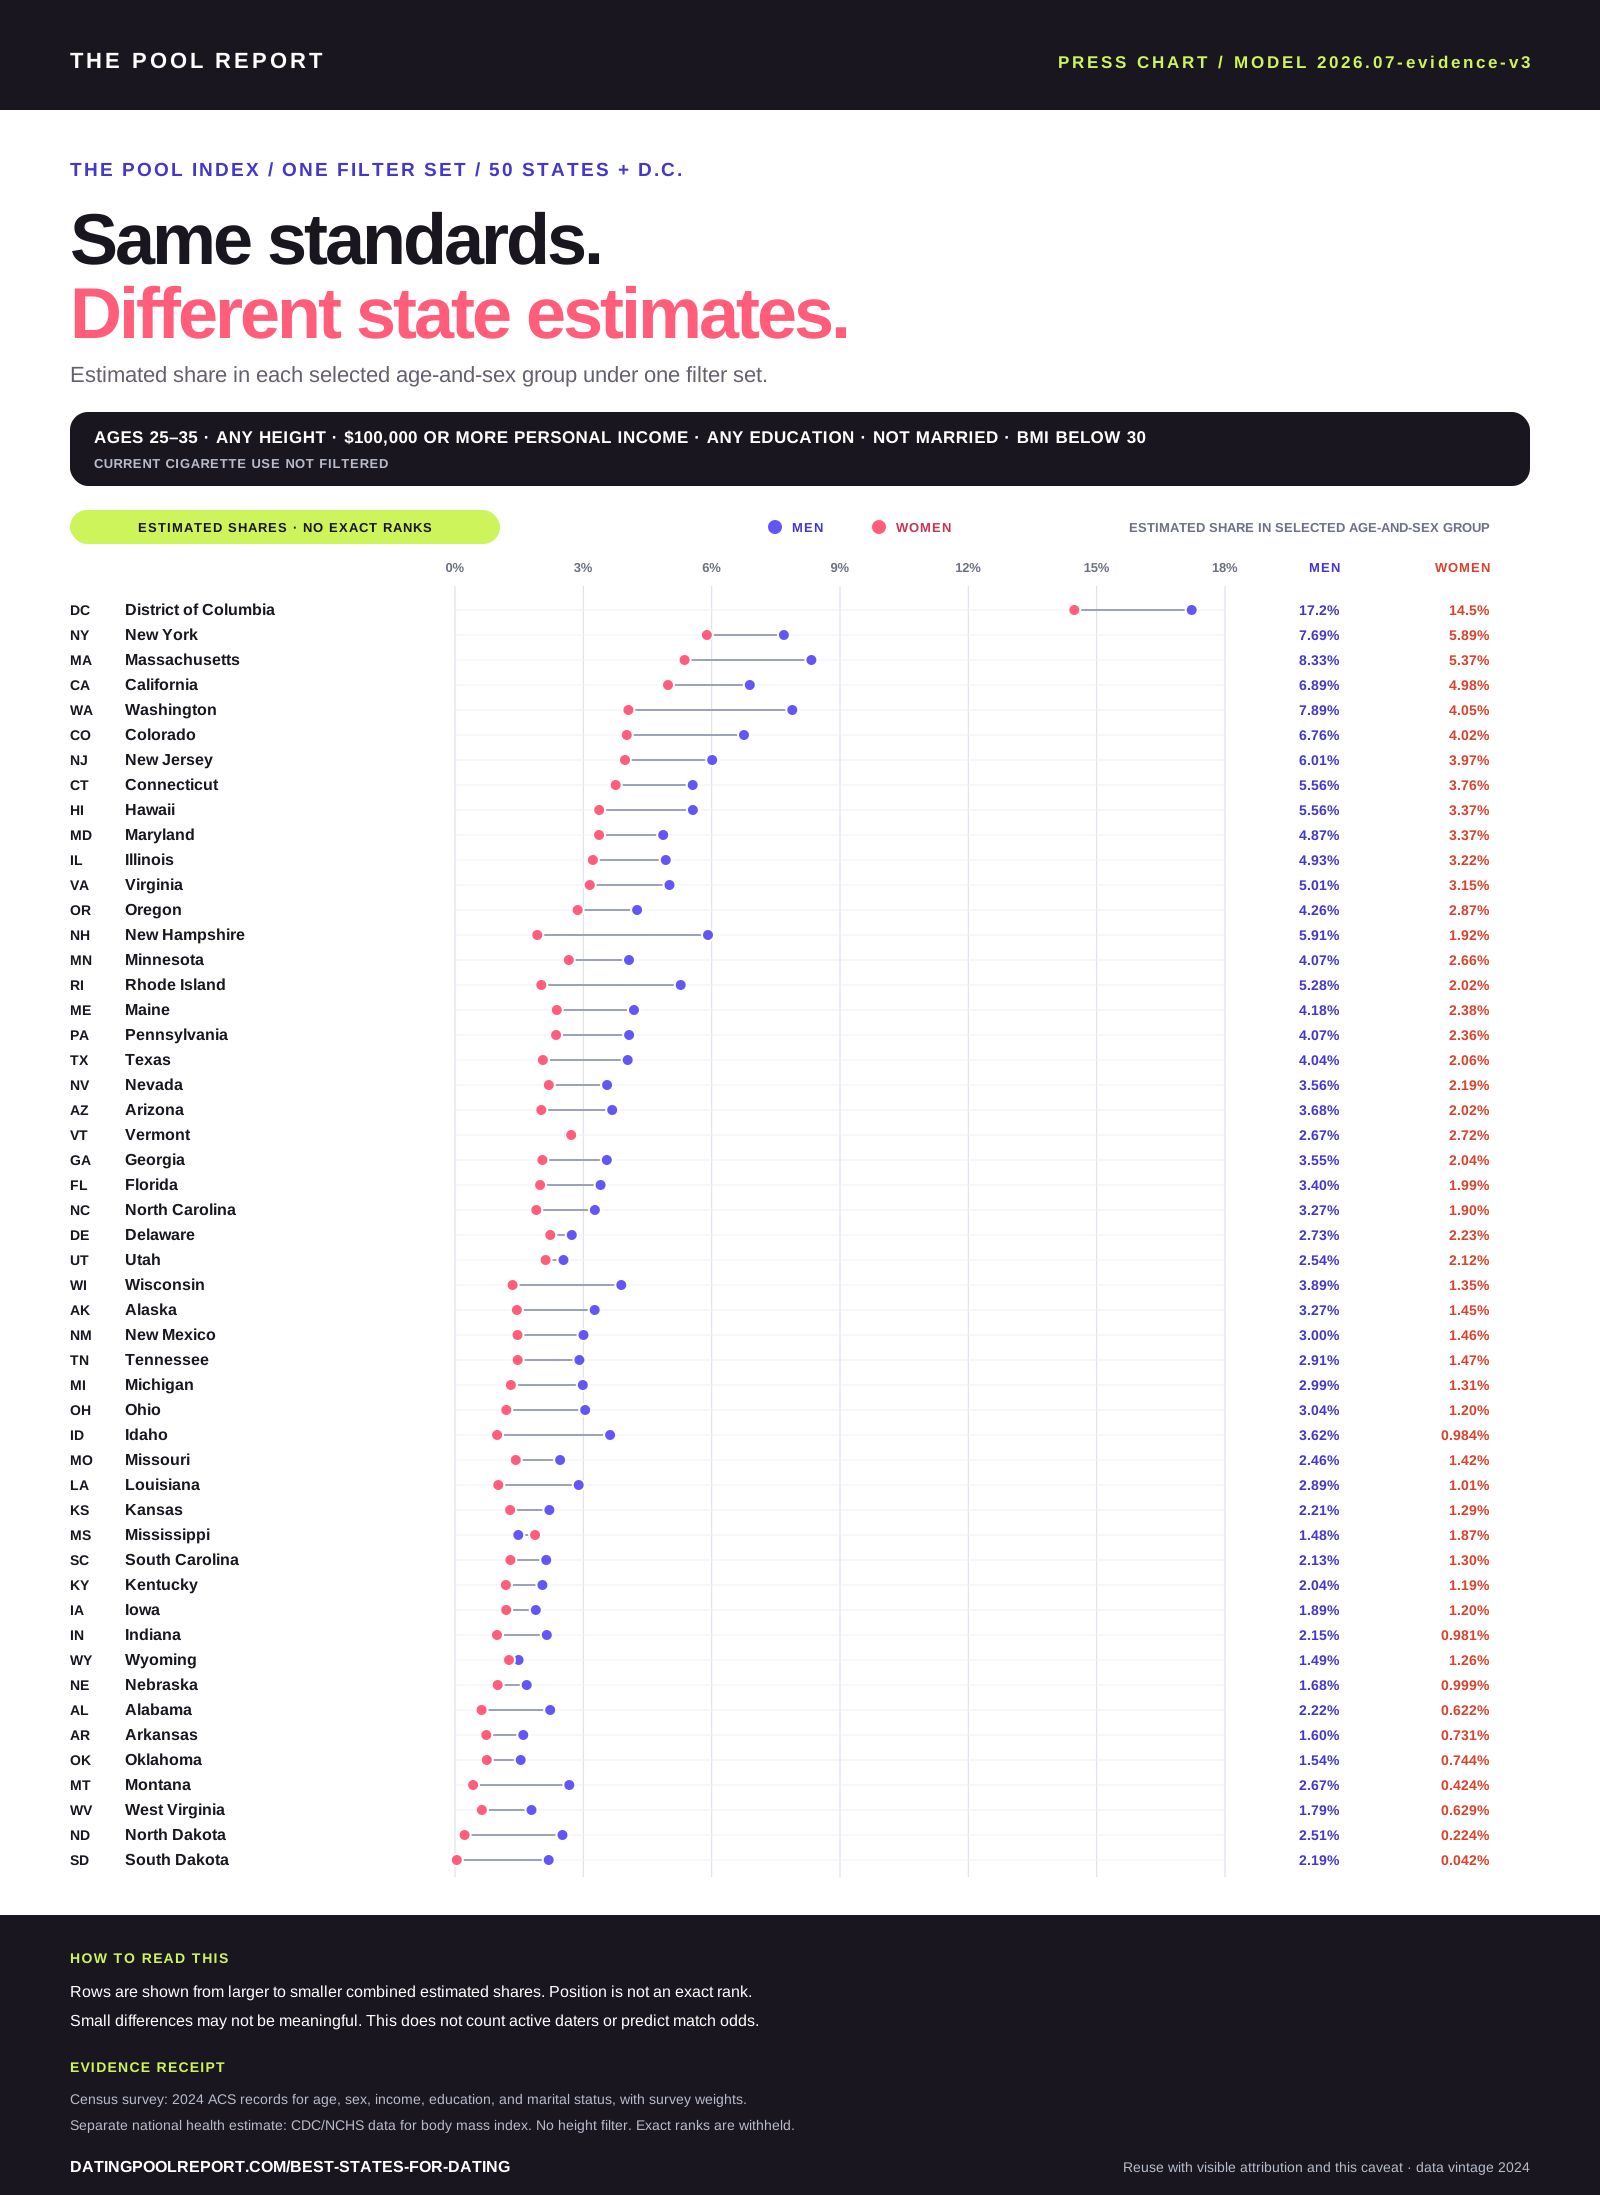
SVG / CHART2026 model · 2024 ACS · 2021–23 CDC
Same filters in every state
All 50 states and D.C. in one source-labeled chart. Exact ranks are withheld.
Download press chart →Download charts, data files, and ready-to-use citations. Each number includes its source, the group it describes, and its limits.
research@datingpoolreport.comUse the same filters for every state. Choose a file by format, source year, and intended use. The chart shows one estimated share for men and women in each state. We do not publish exact ranks because small differences may not be meaningful. Census records measure age, income, education, and marital status together. Separate CDC surveys estimate height, BMI, and current cigarette use.
All 50 states and D.C. in one source-labeled chart. Exact ranks are withheld.
Download press chart →| state | group | estimate |
|---|---|---|
| Full state rows in the download | ||
Estimated shares, group sizes, uncertainty ranges, and overlap assumptions.
Download CSV →{
"model": "2026.07-evidence-v3",
"filters": { ... },
"sources": [ ... ],
"limits": [ ... ]
}Filters, calculation date, uncertainty ranges, and source-overlap assumptions. No key or account is required.
Download JSON →Definitions for each field, evidence type, model limit, and what the estimate can mean.
See the method →The Pool Report. “The Pool Index: Directional State Point Estimates for Your Dating Standards.” 2026. https://datingpoolreport.com/best-states-for-dating. Estimates use 2024 ACS PUMS person-level weights and labeled 2021–2023 NHANES inputs. Replicate-weight uncertainty is not included; small order differences are not evidence of a meaningful state difference.
For a specific filter set, cite the full result URL you used. Include “modeled estimate” in headlines or captions. This means the number combines source data. Do not call the result a count of compatible partners.
This Census source measures age, sex, personal income, education, and marital status together. It uses person-level survey weights.
U.S. Census Bureau source →This CDC health survey measures height and BMI. The calculator applies these estimates separately because this survey does not measure the Census filters together.
CDC/NCHS source →This CDC survey gives current-cigarette use by age. The calculator applies that national estimate when you select the optional filter.
CDC/NCHS source →Add ?creator=your-handle to a short link to keep creator credit through the calculator session. The link opens the matching research or calculator page.
I ran the same list against both pools. Here is what the estimate changed.
datingpoolreport.com/go/standards-testOpen page →Which filter changes the estimate most? I tested the full list together.
datingpoolreport.com/go/too-pickyOpen page →I used one list for both groups. Here are the two estimates.
datingpoolreport.com/go/same-standardsOpen page →What share of men meets the full list when the filters are counted together?
datingpoolreport.com/go/men-meet-standardsOpen page →What share of women meets the same combined filters?
datingpoolreport.com/go/women-meet-standardsOpen page →See how the six-foot estimate changes when age, income, and relationship status overlap.
datingpoolreport.com/go/six-feetOpen page →Personal income is not household income. Here is the full Census group used for the percentage.
datingpoolreport.com/go/men-six-figuresOpen page →Same age range, same personal-income definition, and same Census method.
datingpoolreport.com/go/women-six-figuresOpen page →See how the same dating filters change from state to state.
datingpoolreport.com/go/best-stateOpen page →A viral $0 dating-spend claim needs the survey denominator attached.
datingpoolreport.com/go/dating-spendOpen page →Pew surveyed U.S. men ages 18–29 in July 2022. “Single” meant they were not married, living with a partner, or in a committed relationship.
Open the claim review →Pew used the same definition for U.S. women ages 18–29 in its July 2022 survey.
Open the claim review →51% reported spending nothing on dating in the 2026 Bank of America Better Money Habits survey, conducted online by Ipsos among 1,133 U.S. Gen Z adults ages 18–29, margin of error ±3 percentage points. The denominator is every surveyed respondent, including people who were not actively dating.
Read the benchmark note →When too few measured-height records support an exact rate, say “1 in X or rarer” or “up to X estimated people.” Name the full group used for the result in the same sentence.
See how to read a result →The two-pool mark for white, fog, or other light backgrounds. Use the SVG as provided. Do not recolor, stretch, or add effects.
Download light mark →The same mark for dark backgrounds. Leave clear space at least as wide as the center dot on all four sides.
Download dark mark →We apply the same filters to men and women.
See who publishes it →The Pool Report is an independent data project. It estimates how many U.S. adults meet selected dating filters and checks relationship claims against their sources. Find its tools and reports at datingpoolreport.com.
How to credit us: credit quotes and figures to “The Pool Report Research Desk, datingpoolreport.com.”